What To Track For CRO of Your Automotive Website

When it comes to automotive sites (eg. webshops that sell vehicle parts), it’s good to track additional events that can give more insights into visitor behavior, their actions, and needs. In this article, we will summarize and explain additional tracking events that we use in automotive eCommerce sites as a foundation for conversion rate optimization of those sites.
If you’re new to this phrase, let us clear some clouds over this topic. Basically, conversion rate optimization is a process of increasing the number of (believe it or not) conversions on your website. Conversions are desired actions that we would like our visitors to perform while they are on the site itself. Conversion rate optimization (CRO) of the automotive eCommerce site has no difference from any other CRO service. Its goal will always be to:
- Increase the number of visitors
- Increase average order value
- Increase the number of transactions
In order to get those numbers up, you need to understand how the visitor shopping (customer) journey is working, from impressions to purchases. There are a couple of features that we consider a must-have for automotive aftermarket websites. In our experience, these features are Year/Make/Model, Visual Parts Product Diagrams, and My Garage.
The power of data you can collect from your visitors is a foundation for any serious digital marketing activities, no matter if it’s a UX, PPC, or SEO decision to be taken.
How to track behavior on your Year Make Model automotive feature?
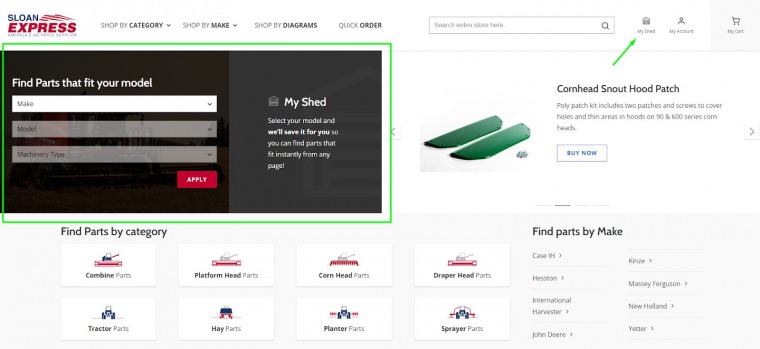
Year, Make, Model (YMM) is a filter feature that enables visitors to see only vehicle parts that suit their vehicle.
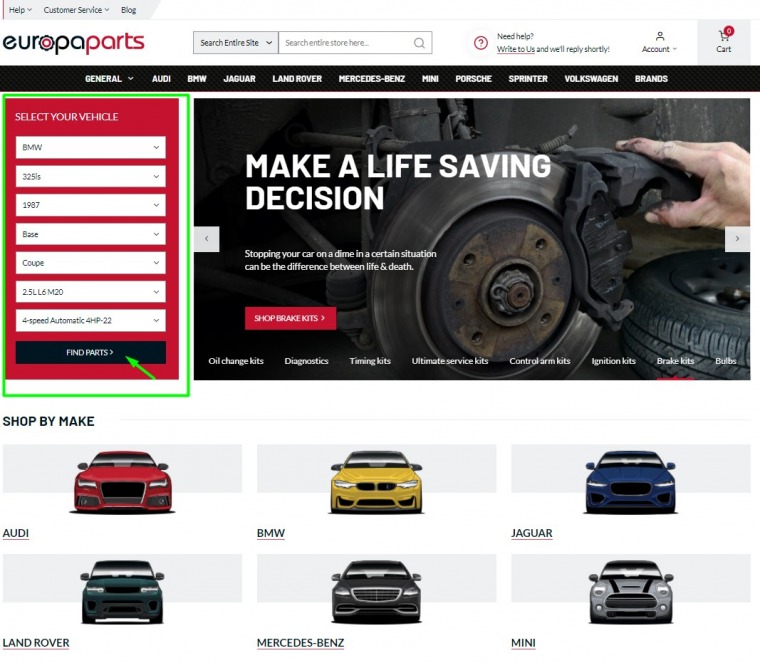
Example of Automotive eCommerce webshop homepage with YMM filter
A vehicle’s make is the brand of the car, while the model refers to the name of a model of that brand. When a visitor lands on a homepage of an automotive page he’s interested only in parts that suit their car.
Therefore, to find only relevant car parts they want, visitors enter some information about their car in a YMM search filter. They enter information regarding Make, Model, Year, SubModel, Body, Engine, and Transmission. Every option has its dropdown menu so the visitor can easily select an option that’s relevant to his vehicle.
What I suggest tracking is what options visitors select in the MMY filter. This information can be very helpful in a couple of ways.
First of all, it improves the user experience because it basically makes the webshop show only car parts made for your car. On the other hand, you can create audiences you want to target with your PPC campaigns based on their vehicle make, model, or any other option they’ve selected. Also, this information helps you determine who are your webshop visitors based on what car brand and model they drive.
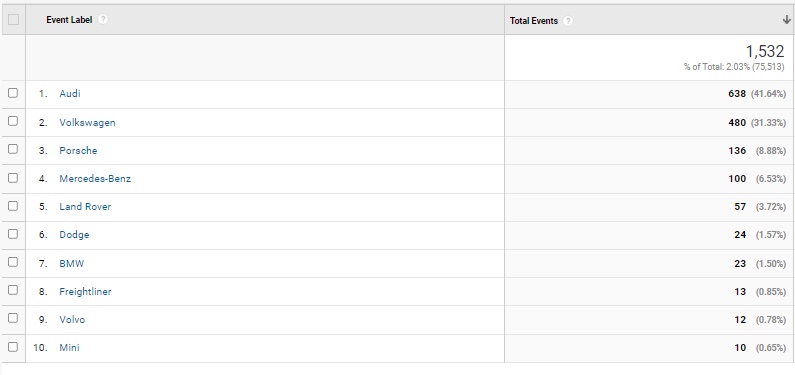
Example from Google Analytics, of vehicle, make (brand) data visitors selected in MMY filter
Diving deeper into your visitor needs you can track eg. what parts did they search for in a particular period of time, and more precisely for what kind of a car. Tracking that kind of search can give you insights into what parts you can preorder and prepare for sale. You also can get to know your visitors better by knowing what cars they drive.
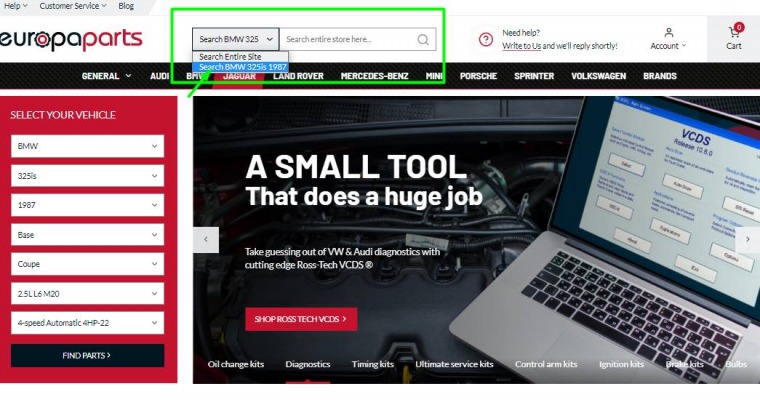
Search option based on visitors selection in YMM filter
What to track on your automotive visual product parts diagrams
Parts diagram modules help to visualize the vehicle and show its parts interactively to a visitor. That means that a visitor can visually recognize what part of a vehicle he wants and simply click on it, see the details, and purchase. The image below gives you an example of what the parts diagrams page looks like for a specific part on a vehicle, in this case, a John Deere Combine Belts.
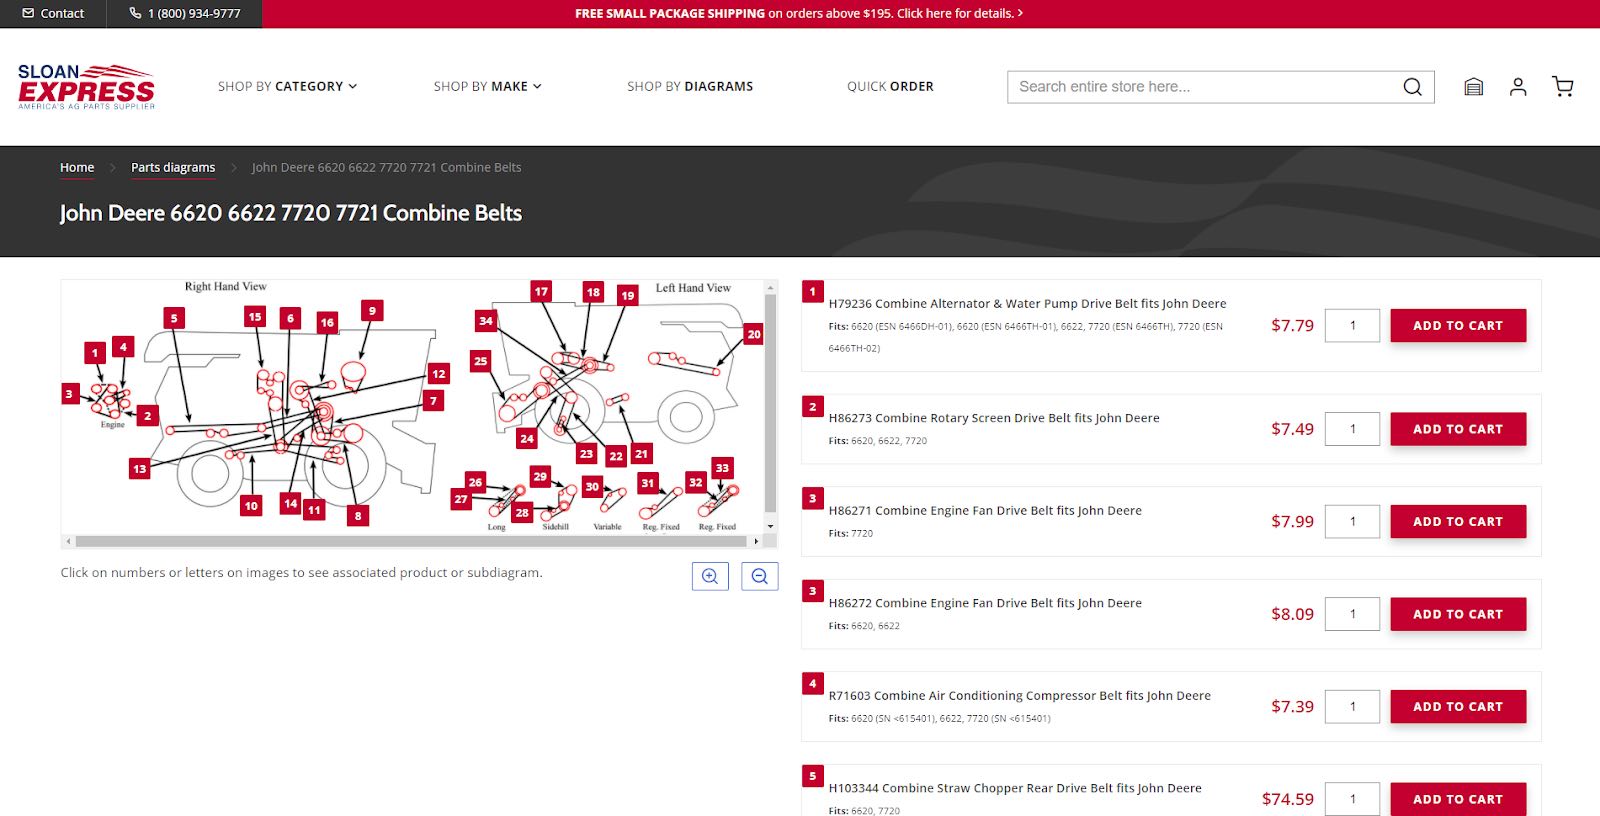
Shop By Visual Parts Diagram
In this case, you want to know if your visitors actually use the parts diagrams option or not, and then again what items do they look for, and do they purchase them?
First and foremost you want to check if you’re getting visitors on the parts-diagrams page at all. You can track the visits to the parts diagram page simply by selecting Behaviour > Site Content > All pages in Google Analytics and then finding the parts-diagrams URL part, like in the example in the next picture.
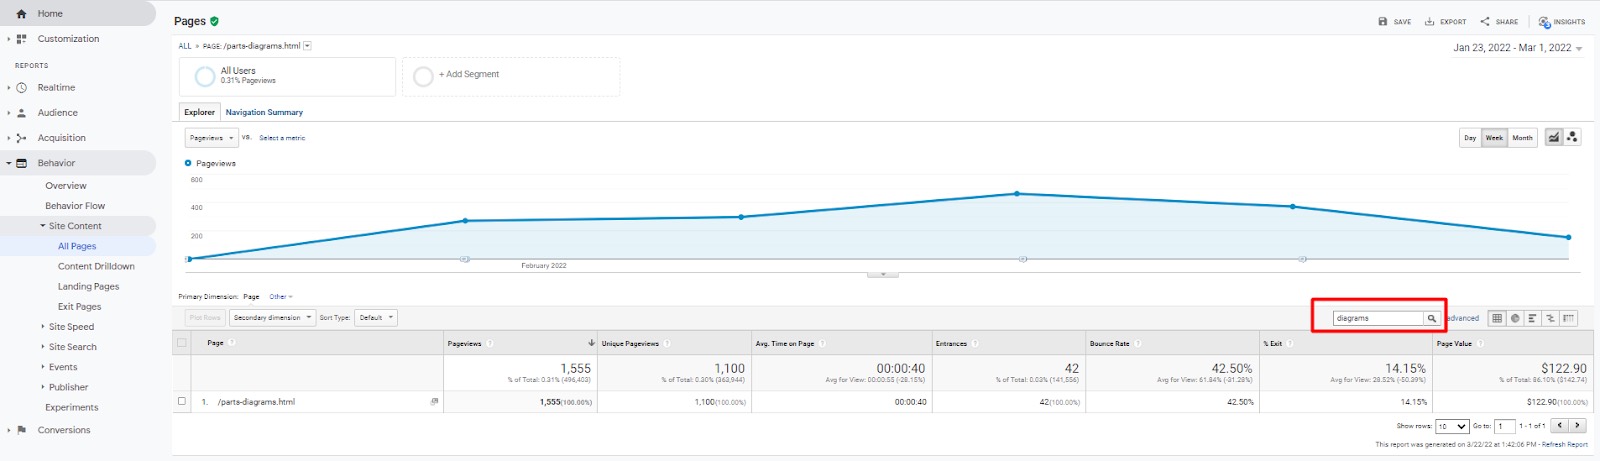
Visitors on the parts diagrams page
Going further, do visitors add the products from the product diagram page to the cart? The best option is to create an eCommerce event eg. “Add to cart from product diagrams page”, as shown in the pictures below
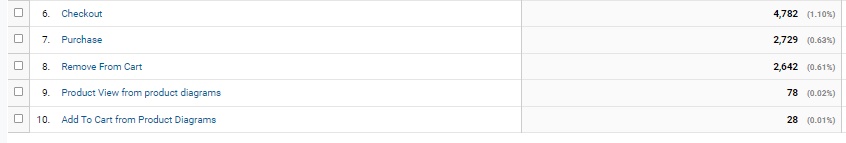
Google Analytics “Add to cart from product diagram page” event
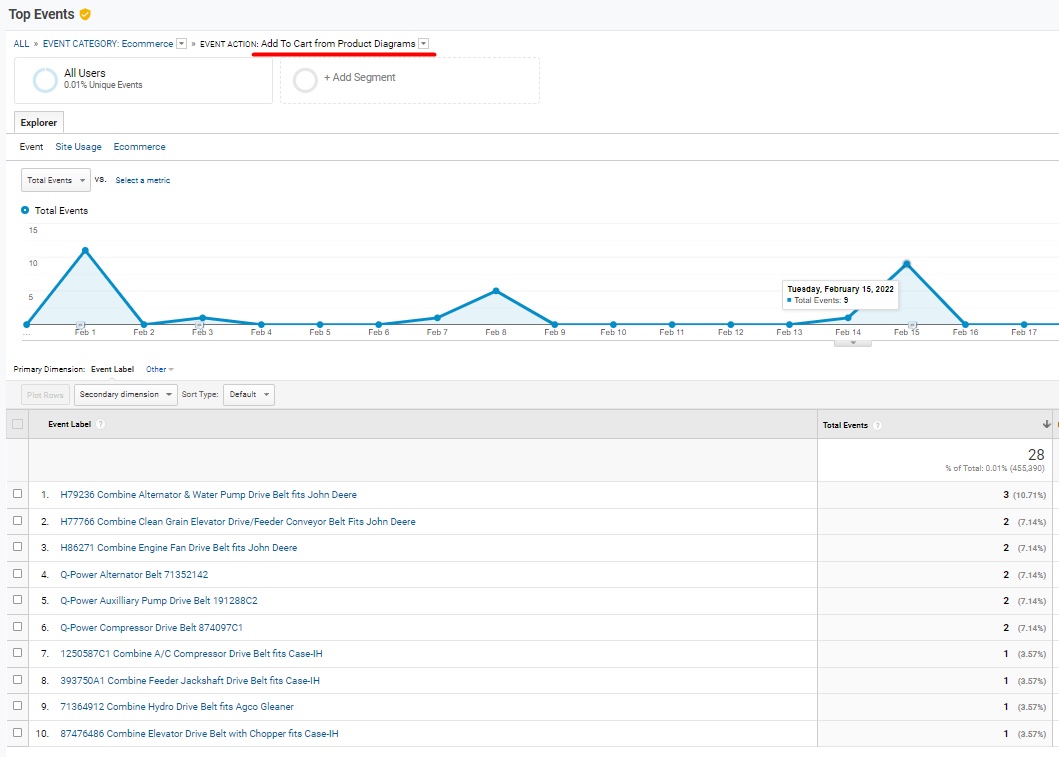
Products added to cart from diagrams page
The best practice is to create an event in Google Analytics with Google Tag Manager. That way you have more control over the data you are sending to Google Analytics. Keep in mind when configuring your triggers and your tag to test it properly and check if the data going to Google Analytics really represents the action you want to track.
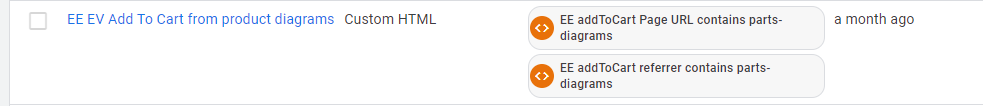
GTM Tag with triggers
Depending on how is the parts diagrams page configured, in this example, we had two triggers, one activates the tracking tag when a visitor adds a product to a cart directly from the parts diagrams page, and the other trigger activates the same tag in situations when a visitor, before adding the product to the cart, clicks to preview the product details from parts diagrams page and then, from a product page, adds that product to cart.
That way you can compare how often your visitors are actually interacting and using the diagrams option in regards to the “standard” webshop product placement. And later of course optimize the webshop based on the data you received and analyzed.
My Garage (My Shed) Feature for returned buyers
Parts finder that automatically saves the selected vehicle in “My Shed” in this example
Another great thing to have in an automotive store is an option that automatically saves the model of the vehicle that the visitor chooses. The picture above gives you an example where the visitor enters his model and then the webshop automatically saves it. The visitor must create an account to save his vehicle so he already has it in his Shed when he returns to the webshop. That way we get a new customer in our database and more options and chances to convert him into a returning visitor and a regular buyer.
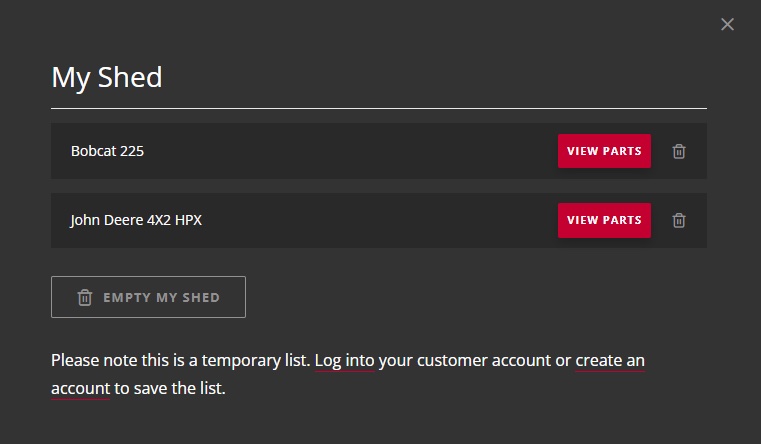
My Shed (or My Garage) Feature Example
You can track how many visitors registered after you implemented this option by creating a Google Analytics event.
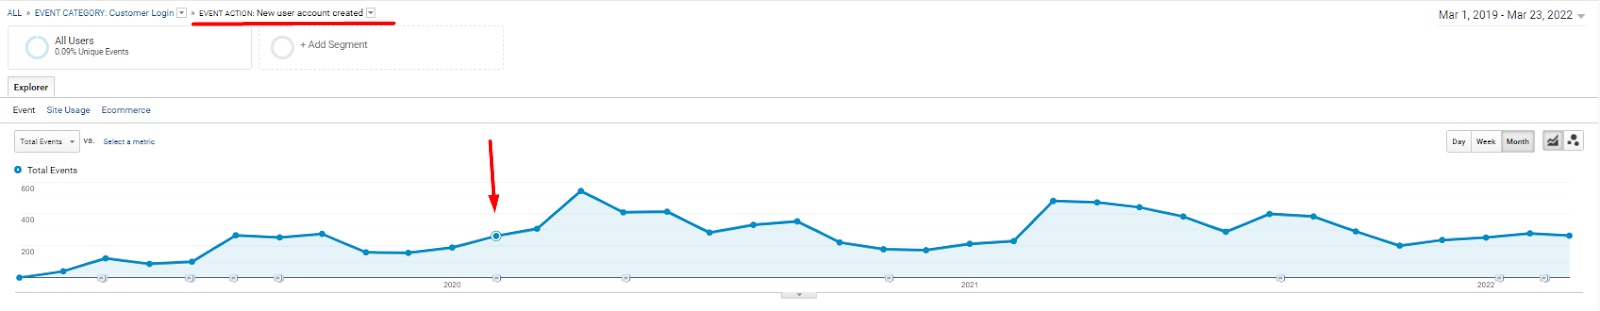
Google Analytics event – new user account created
My Garage feature can give you better insights on what vehicle parts your visitors need in order for you to prepare for the upcoming orders and plan your costs and orders accordingly. It is also useful information for any email marketing campaigns you may have. This can be tracked as an event in Google Analytics.
The most important thing is to get the values that visitors select and transfer them to Google Analytics according to the action they did. The image below gives you an example of vehicles users filtered out which were then automatically “parked” in the Shed.
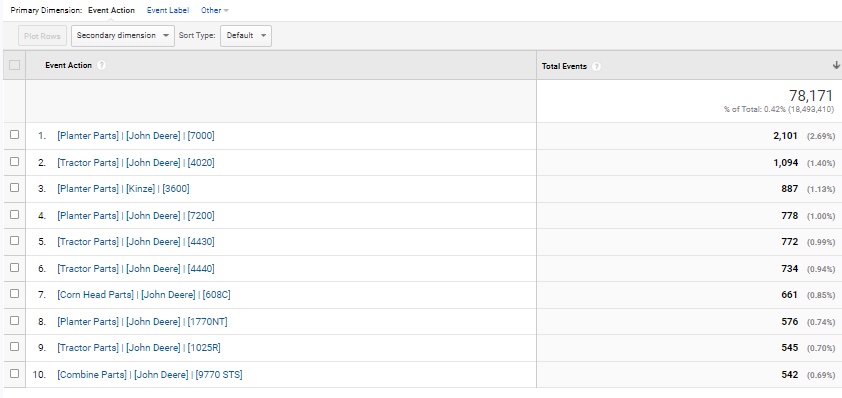
Vehicles that users filtered out
Conclusion
We’ve already written about the importance of the measurement plan for your digital marketing activities. If you’re aiming on getting those numbers up for your automotive eCommerce website, understanding that to track is a base foundation for conversion rate optimization of your store. Obviously, tackling UX challenges is an important way to go, and you can go through some of our recommendations in a blog post in which we resolved automotive website design challenges.
If you’re looking for someone to help you out with your automotive eCommerce business, check out the eCommerce full-service support we’ve created for automotive merchants!


1 comment
thanks for this atricle……. goood