Do you or your client have a popular Facebook fanpage?! If so – this article might be interesting to you, but first – let’s start with definition of “hammering”, although the term is not unknown to webmasters…
define: hammering:
- gerund or present participle: hammering
hit or beat (something) repeatedly with a hammer or similar object. - strike or knock at or on something violently with one’s hand or with a hammer or other object.
- work hard and persistently
“they must hammer away at these twin themes day after day” - inculcate something forcefully or repeatedly.
Hard and persistently.
What’s website hammering and how to spot it?
Website hammering, originally derived from (“hard and persistent”) process of trying to connect to FTP servers in short period of time, nowadays includes all sorts of services, and can cause all sorts of availability and performance issues. In this particular case, it would be getting “hard and persistent” page requests.
Do you check your web logs from time to time?! I know, none us do as often as we should, as browsing through them can be a mix of painful experience and eye-bleeding match-a-pattern game.
In one of those “games” I noticed something interesting – web server was receiving loads and loads [at least a half a dozen per second] of page hits for a recently shared URL on a Facebook fanpage. “Oh, this traffic must be looking nice in Google Analytics real-time report” – I thought and logged into GA just to find out nothing but usual – regular traffic of a pageview each second or a few seconds…
After 24 hours of waiting on Google Analytics to consolidate data for previous day, few URLs shared previous on Facebook were examined and data in Apache website logs were compared to Google Analytics pageview reports. Discrepancy in pageviews for specific URLS between website Apache logs and GA was remarkable, to say the least:
For each shared URL data discrepancy was similar to this example:
~ 10K page GET requests for a page in Apache access logs
~ 3K pageviews in Google Analytics
At this point I thought that for some reason:
- bots/crawlers have gone on a rampage
- website might have been under some kind of [not so efficient] DDoS attack
- Google Tag Manager (GTM) or GA codes were not fired properly
Testing hypotheses
Testing for “bots/crawlers” was fairly easy – a chunk of access log file [with request to a specific page] was submitted to an online log analyzer – LogCruncher. Crunched numbers disapproved hypothesis about bots/crawlers as 95% of all requests had different IP, and all those IPs were from ISP pools for standard users. So, the sources of traffic were regular users and their devices.
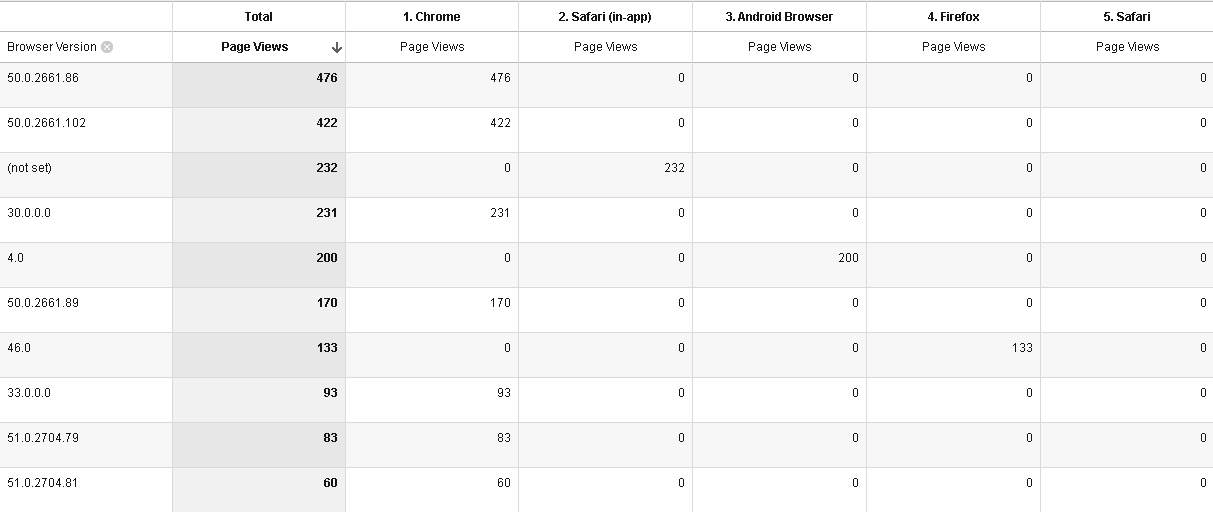
A deeper inspection of traffic was required. No patterns in missing traffic in Google Analytics could be found – all device categories, all manufacturers, all OSs, all browsers – they all had their share in Google Analytics, but still, a huge portion of traffic was missing. There must be a pattern, but it’s impossible to find it in Google Analytics.
For further Apache logs inspection and I used GoAccess – nice little Linux utility that does just what I needed – groups requests by various dimensions – this might help me in finding the pattern.
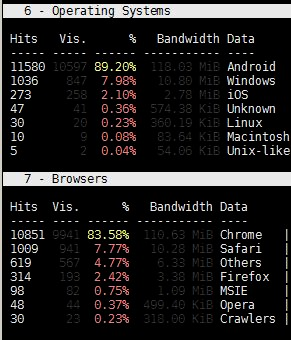
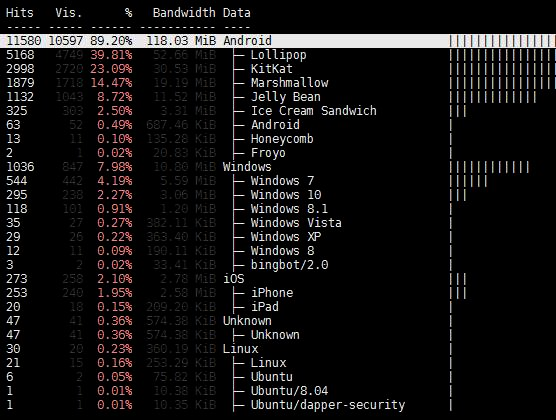
And it did help… most of the requests were from Android, and since there were more requests from Android than there were missing pageviews – it was a strong indicator in which direction further analysis should go. From that point the rest was relatively easy – observed traffic was reduced to Android traffic only, and the next two hints were spotted right on.
These two hints also eliminated DDoS, since surge in page loads corresponded with link being shared on Facebook.
- HTTP referer: “http://m.facebook.com”
- User-Agent has: FB_IAB/FB4A;FBAV (Facebook in-app browser)
One would say – that’s it – Facebook in-app browser blocks GTM or GA from firing. A bold statement that needs strong arguments, which translates in more hypotheses to test. 🙂
A few quick tests were done – and it proved that FB in-app requests were tracked as usual – GTM and GA fired as usual, _ga cookie was set and used. Could it be that GTM/GA in FB in-app are blocked just on some devices, while firing regularly on others?!
So I did two tests for this thesis using measurement protocol [did it by the book, using _ga cookie if available, etc.]:
- created measurement protocol [MP] hit [using image] and put it in NOSCRIPT on the page
- this one would catch those that have JS disabled
- MP was fired using specific data source parameter
- created measurement protocol [MP] hit [using image] and fired using JS if there were no GTM and GA objects on the page
- this one would catch those that have JS enabled, but have GTM/GA blocked using adblocker/router etc.
- MP was fired using specific data source parameter
- benchmark image: created measurement protocol [MP] hit on a different GA property, and fire it using plain image placed somewhere in BODY
- this hit would be used as benchmark – since it would fire as image tag on every page view in client’s browser, it should collect regular + NOSCRIPT + GTM/GA blocking requests [except for those who block image loads]
- benchmark server-side call: created measurement protocol [MP] hit on a different GA property, and fire it during page generation on the server [complete server-side hit, does not depend on web client]
- this hit would be used as absolute benchmark – if there’s a GET request – it would be executed (in case there are no issues with network traffic ;-))
Theoretically, this would would cover all possible cases, and after the test I would create custom reports based on data source parameter and would look for patterns. The cases are:
- GTM/GA are executed as usual
- JS is blocked [GTM/GA are not executed], but MP is fired instead (via image)
- GTM/GA are blocked, but since JS is enabled – it will create MP image if GTM/GA are not initialized
- benchmark MP image is fired and should have ALL page views and match Apache logs 100% [since MP call is server side and does not depend on
- server-side benchmark is fired on every GET request for a page
The Results
I thought that I will finally get ~100% match between Apache logs and GA. The result?!
Almost no increase! A slight, ~5% increase in number of pageviews in GA, so instead 10K vs. 3K, it was 10K vs. 3.5K – probably due to collecting those who block GTM/GA (well, I finally got GTM/GA blocking rate for the site ;-)).
Benchmark image MP hit should be 10K, right?! Well – benchmark image GA property was showing 3.5K pageviews. That meant that FB in-app did not send request for a regular image on a page!
Benchmark server-side MP: the only benchmark that was ~100% match with Apache logs was server-side MP call that was put in the main app code. No surprises here.
So, at this point I had these pieces of a puzzle::
- HTTP referer: “http://m.facebook.com”
- User-Agent has: FB_IAB/FB4A;FBAV (Facebook in-app browser for Android)
- GTM/GA are not loaded
- regular images are not loaded – FB in-app requests only for HTML page
More questions, until…
So, a large portion of traffic was still missing, and I was stuck – there were no more information from the Apache log files that could be squeezed out, and I could not recreate situation where my traffic in Facebook in-app would be logged in Apache, but not in GA.
I did not know whether this traffic is valid or not, should I block it or not, and blocking by User-Agent signature would have a large number of false-positives (this would block regular traffic as well).
Test traffic on devices I made had the same HTTP referer and User-Agents had the same pattern [FB_IAB/FB4A;FBAV], but that traffic was tracked and visible in Google Analytics. I was not able to recreate something that was happening to ⅔ of visitors, no matter on how many devices I tested Facebook app.
There was just one more thing to inspect – HTTP request headers. Made a little HTTP header request logging routine, and started collecting HTTP headers. And … bingo!
[stripped out not so important parts of the HTTP request]
X-Purpose: preview
x-fb-sim-hni: xxyyy
x-fb-net-hni: xxyyy
Cache-Control: no-cache
referer: http://m.facebook.com/
cookie: _ga=GA1.2.xxxxxxxxx.yyyyyyyyy;
accept-encoding: gzip, deflate
x-fb-http-engine: Liger
Connection: keep-alive- x-fb-net-hni & x-fb-sim-hni – used for MCC+MNC (Mobile country code + Mobile network number – identifies country and provider)
- x-fb-http-engine: Liger – this is the identifier of the engine, BUT, FB in-app does not send it every time! It is being sent only when X-Purpose is sent:
- X-Purpose: preview – page prerender/prefetcher HTTP header
These are the pieces that were missing to properly identify missing requests in Google Analytics. Puzzle-pattern is now complete!
Conclusion
Facebook Android in-app sends SOME page requests with X-Purpose: preview header (and identifies as x-fb-http-engine: Liger), probably for prefetch/preview purposes [faster load for users]. Presumeably FB in-app has some internal algorithm (similar to Chrome’s prerender) that decides what will be preloaded and when. More on harnessing FB in-ap pressure and how browser’s prefetch/prerender can be used to speed up (Magento) sites will be covered in future articles – stay tuned!
We all know that Magento CPU cycles come at a price, a hefty one. You should test on your own whether this FB in-app feature has implications on your web server performance and expenditure.
Are you affected?
How to test it on your site?! Here’s help for configuring Apache web server, something similar could be done with nginx as well.
- edit main Apache config [search for LogFormat, and add new LogFormat]
LogFormat "%h %l %u %t "[%{x-fb-http-engine}i | %{X-Purpose}i]" "%r" %>s %b "%{Referer}i" "%{User-Agent}i"" fbligerprev - edit virtual host config, search for CustomLog and just above that line add:
SetEnvIf x-fb-http-engine "Liger" fbliger
CustomLog /var/log/path-to-your-logs/access_log_fbliger fbligerprev env=fbliger
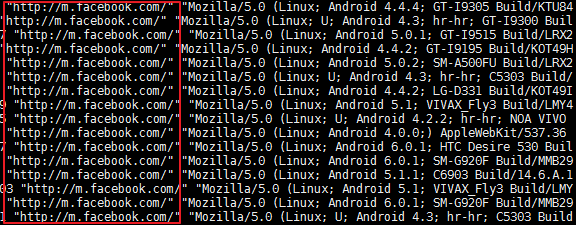
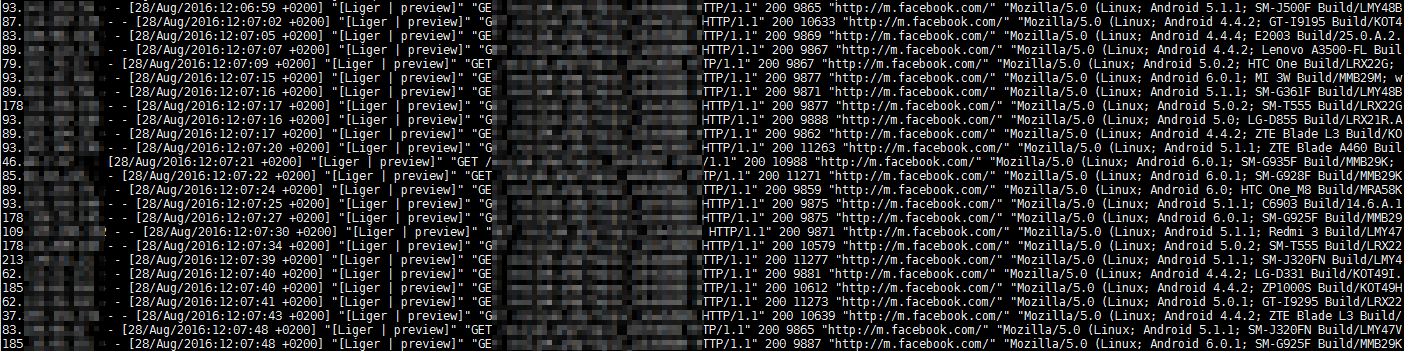
This will log all “Liger/preview” requests in a separate file which you can examine and make appropriate decisions on how you’ll be handling this type of traffic on your site.
Please, share your “liger rate” in the comments below. Thanks!
The log file /path/access_log_fbliger would look like:
Interesting facts:
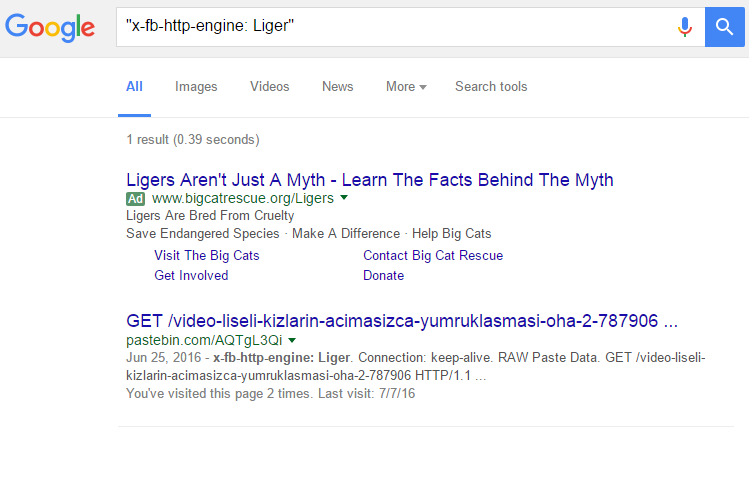
Fact #1: there was only one Google search result [googlewhack] for “x-fb-http-engine: Liger” at the time of writing this article + one AdWords ad 😉
Fact #2: The liger is a hybrid cross between a male lion (Panthera leo) and a female tiger (Panthera tigris). The liger has parents in the same genus but of different species. [Wikipedia]
Is your site affected by this? Please, share your experience…
Update 04.10.2016.
Article on mitigating this FB in-app hammering can be found here [for both Apache and nginx]: Mitigating Facebook’s “x-fb-http-engine: Liger” site hammering using Apache or nginx