If an e-commerce site is making $100,000 per day, a 1 second page delay could potentially cost you $2.5 million in lost sales every year.
Why is page loading speed so important!? There are just too many articles that prove how page speed loading is one of the crucial ingredients for a successful online store. So we will try to describe a couple of tools which you can use to test Magento speed and performance, and one in particular we will cover in this blog post, http://www.sitespeed.io/.
There are plenty of online tools that can be good starting point:
- Page Speed, an open source Firefox/Firebug add-on that evaluates the performance of web pages and gives suggestions for improvement.
- YSlow, a free tool from Yahoo! that suggests ways to improve website speed.
- WebPagetest shows a waterfall view of your pages’ load performance plus an optimization checklist.
- In Webmaster Tools, Labs > Site Performance shows the speed of your website as experienced by users around the world.
With sitepseed.io we can do a little bit more with more power and control:
- Check your site against the latest web performance best practice rules.
- Analyze many pages on your site, not just one!
- Test for desktop or mobile!
- Fetch Navigation Timing API metrics and your own custom measurements (User timing).
- Compare sites, keep track of your competitors.
Installation
Documentation site has pretty well described installation process.
For start we need:
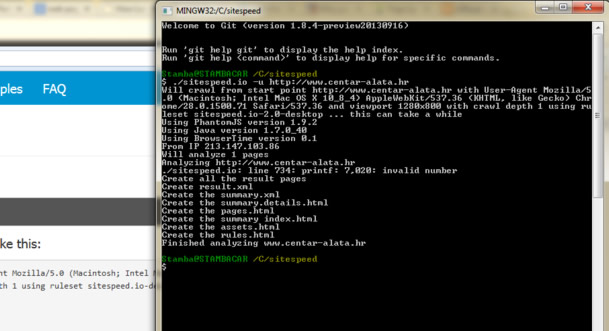
After we have everything installed we can conduct simple test typing command:
$ ./sitespeed.io -u http://www.centar-alata.hr/
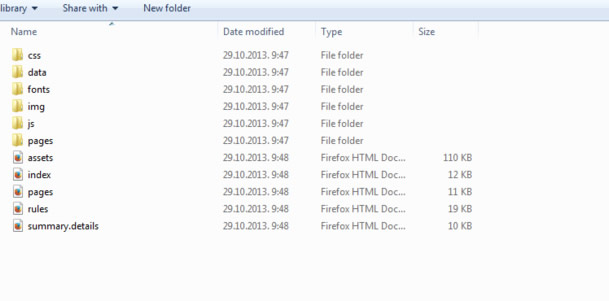
After the test is complete, we can start analyzing collected data, and if we go to look inside sitespeed.io install folder / sitespeed-result / www.domain-name.com / we will find the following folder structure:

The result from analysis is that the data directory holds all the raw data files. The errorurls.xml contains URLs that couldn’t be fetched. The har directory holds all the HAR-files produced when testing the pages. The metrics contains Browser Time XML – the metrics collected from the Navigation Timing API. The result.xml contains all the analyzed data for all pages. The summary.xml is the XML representation of all the tests (that is used in the summary page).
Pages hold the result (as HTML) for all unique page tests.
The pages.html is all pages data, summarized in one page. The index.html is the summary page, holding information on a high level. Then the summary-details.html holds the summary info on a detailed level, here you will see the nitti gritty details of the site. rules.html is a presentation of the rules used to calculate the score for a page. And the images folder is created if you choose to output the summary as png’s. The errorurls.html shows the list of URLs that couldn’t be fetched (the file will not exist if all urls could be collected). The assets.html shows the top 200 most used assets across the pages.
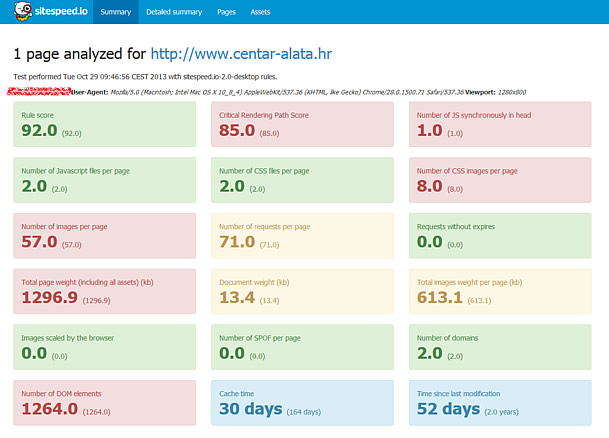
Please note this is only simple demonstration what can be tested – this is our test result summary page:

Sitespeed.io is highly configurable, both in what you can do with it and what type of a report you will see. You have the following options running sitespeed.io:
usage: ./sitespeed.io options

OPTIONS:
-h Help
-u The start URL of the crawl: http[s]://host[:port][/path/]. Use this or use the -f file option.
-f The path to a plain text file with one URL on each row.
-d The crawl depth, default is 1 (one page and all links pointing to the same domain on that page) [optional]
-q Crawl URLs only URLs that contains this keyword in the path [optional]
-s Skip URLs that contains this keyword in the path [optional]
-p The number of processes that will analyze pages, default is 5 [optional]
-m The memory heap size for the Java applications, default is 1024 Mb [optional]
-n Give your test a name, it will be added to all HTML pages [optional]
-o The output format, always output as HTML and you can also output a CSV file for the detailed site summary page (csv) [optional]
-r The result base directory, default is sitespeed-result [optional]
-x The proxy host & protocol: proxy.soulgalore.com:80 [optional]
-t The proxy type, default is http [optional]
-a The full User Agent string, default is Chrome for MacOSX. You can also set the value as iphone or ipad (will automagically change the viewport) [optional]
-v The view port, the page viewport size WidthxHeight, like 400x300, default is 1280x800 [optional]
-y The compiled YSlow file, default is dependencies/yslow-3.1.5-sitespeed.js [optional]
-l Which ruleset to use, default is the latest sitespeed.io version for desktop [optional]
-g The columns showed on detailed page summary table, see http://www.sitespeed.io/documentation/#config-columns for more info [optional]
-b The boxes showed on site summary page, see http://www.sitespeed.io/documentation/#config-boxes for more info [optional]
-j The max number of pages to test [optional]
-k Take screenshots for each page (using the configured view port). Default is false. (true|false) [optional]
-c Collect BrowserTimings data (meaning open a real browser & fetch timings). Default is false. (true|false) [optional]
-z String sent to BrowserTime, so you can choose browser and tries. Default is "-b firefox -n 3".
Now you have a tool which can be used to test your Magento store speed and performance, what will be your next step?
If you need any help, we can do a Magento Technical Audit for your site.


