Session is something that PHP developers use in their everyday work. But how many of you did took some time to actually consider where are they stored and how does that impact your application? Should you even care? Does number of sessions influence performance of your application?
Setting up the test for file-based sessions
To test this, lets create some code. Keep in mind that same apply to larger applications such us Magento as well, but for the purposes of this article, we will keep it simple:
<?php

// Start profiling
$start = microtime(true);

// Set header
header('Content-type: text/plain');

// Adjust session config
ini_set('session.save_path', __DIR__ . '/sessions/');
ini_set('session.gc_probability', 1);
ini_set('session.gc_divisor', 10);
ini_set('session.gc_maxlifetime', 3000);

// Init session
session_start();

// End profiling
$duration = (microtime(true) - $start);

// Output the data
echo number_format($duration, 12) . PHP_EOL;
As you can see from the code above, the script doesn’t actually do anything. It allows you to set session configuration (to allow easier testing) while the only operational code here is – starting a session.
Before we go any further, let’s revise what those session configuration settings actually mean (though, you should already know this):
- save_path – This is self-explanatory. It is used to set location of session files. In this case this is on file system, but as you will se later, this is not always the case.
- gc_probability – Together with gc_divisor setting, this config is used to determine probability of garbage collector being executed.
- gc_divisor – Again, used to determine probability of garbage collector being executed. This is actually calculated as gc_probability/gc_divisor.
- gc_maxlifetime – Determines how long should session be preserved. It doesn’t mean that it will be deleted after that time, just that it will be there for at least that long. Actuall lifetime depends on when the garbage collector will be triggered.
Results of file-based session storage
To complete the test, I have executed 1000 curl requests to my server and stored the result returned by our ‘profiler’. With that data, I have created histogram of the response time:
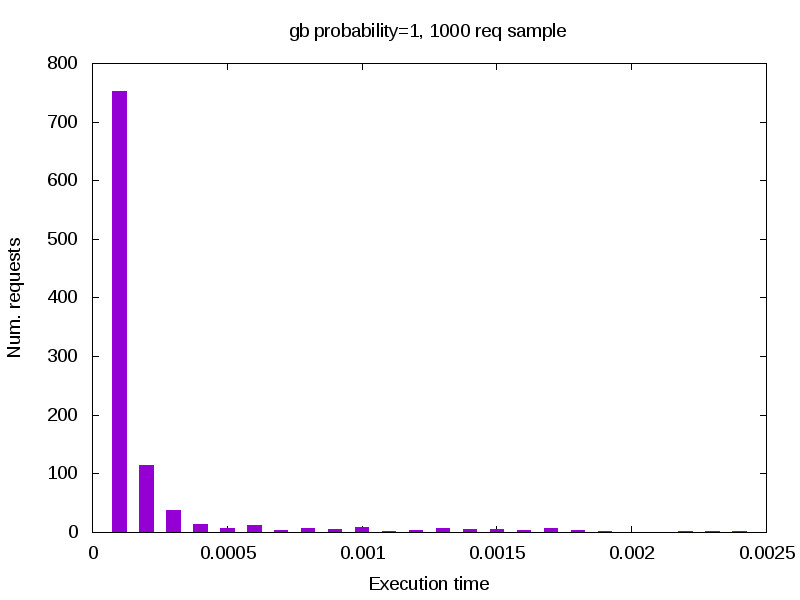
As you can see, nothing really happens, application is working well in all cases. On the other hand, these are only 1000 sessions on extremely simple script, so let’s generate better environment. For the purpose of the test, I have used 14 days. For the number of sessions per day, I have opened random Google Analytics account of one of my Magento project, and determined that we will use 40’000 session per day. Roughly saying, we need 550’000 sessions to begin testing, which were generated by executing same amount of CURL requests to the server.
So we are ready to check what happens. I have executed another 1000 curl requests, again logging the response and generating the histogram of results:
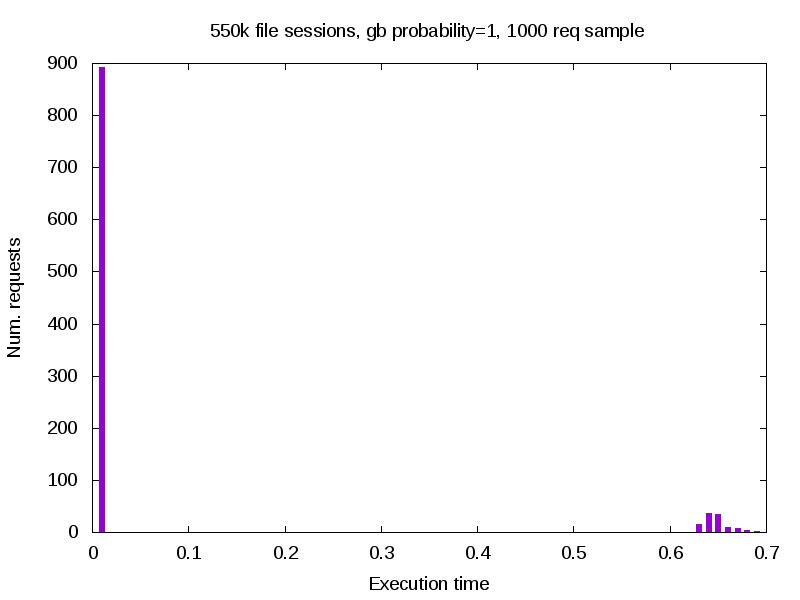
As you can see, the results are very different. We know have two kind of results – ones that are executed properly, and ones that have severe performance penalty (700% longer execution time than usual). So what happened here? Well, simply said – garbage collector was triggered.
Explaining the results
If you recall from the beginning of the post (or take a look at the source), we defined some probability of GC being triggered. This means that given the calculate probability, some requests (to say at random) will trigger GC. This doesn’t mean that actual sessions will be deleted, but all of them will be checked, and delete if required. And that exactly is the problem.
Looking back at the script, we have defined the probability of GC being triggered as 1/10, and that is exactly what is observed on image above – 900 out of 1000 executed properly, while the rest 100 which executed GC took significantly longer to process. To confirm our findings, we will adjust gc_probability to 0 and thus disable GC. Repeating the same test, we observe following:
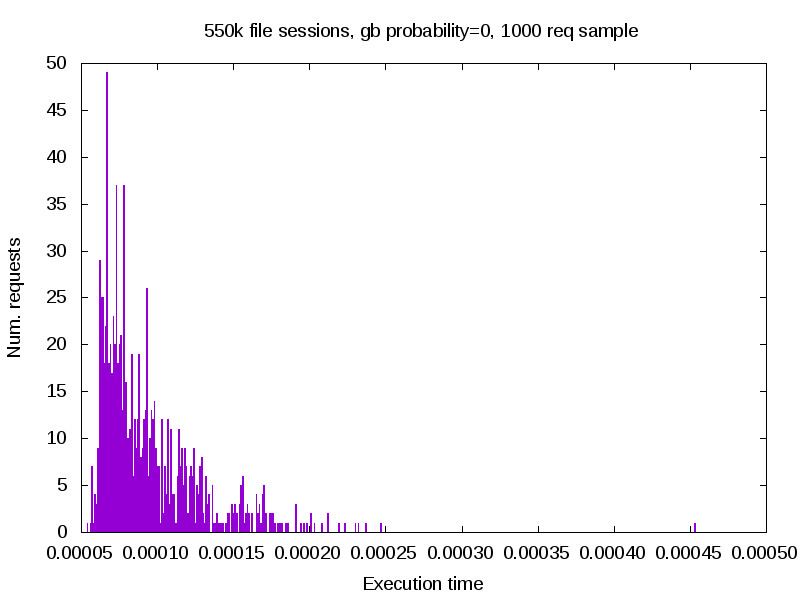
Now, we have only one data set, and that is the first group from the graph before. Difference in execution time is minimal, and application runs evenly across all requests. One may say that this s the solution to the problem, but keep in mind that currently nothing is deleting those session from our storage.
And last thing to note here, that in the example above with th GC turned on, due to my settings, none of the session files were actually deleted. When I did trigger deletion of the files, it took about 27 seconds to clear 90% of the files. If this is going to occur on the production server, you would have nasty problems during those 27 seconds.
Setting up the test for redis-based sessions
Next, I have tried what happens if you put those sessions into Redis server, instead of keeping them in files. For that, we need, among other things, altered version of our script:
<?php

// Start profiling
$start = microtime(true);

// Set header
header('Content-type: text/plain');

// Adjust session config
ini_set('session.save_handler', 'redis');
ini_set('session.save_path',    'tcp://127.0.0.1:6379');
ini_set('session.gc_probability', 0);
ini_set('session.gc_divisor', 10);
ini_set('session.gc_maxlifetime', 30000);

// Init session
session_start();

// End profiling
$duration = (microtime(true) - $start);

// Output the data
echo number_format($duration, 12) . PHP_EOL;
There is a very small difference in code, we only told PHP to used redis-php module to store sessions into Redis server specified by IP. Since I know nothing will happen with lower number of sessions in storage, I went and regenerated those 550’000 session before executing any tests.
Results of redis-based session storage
With everything read, we can execute the tests, the same way we previously did:
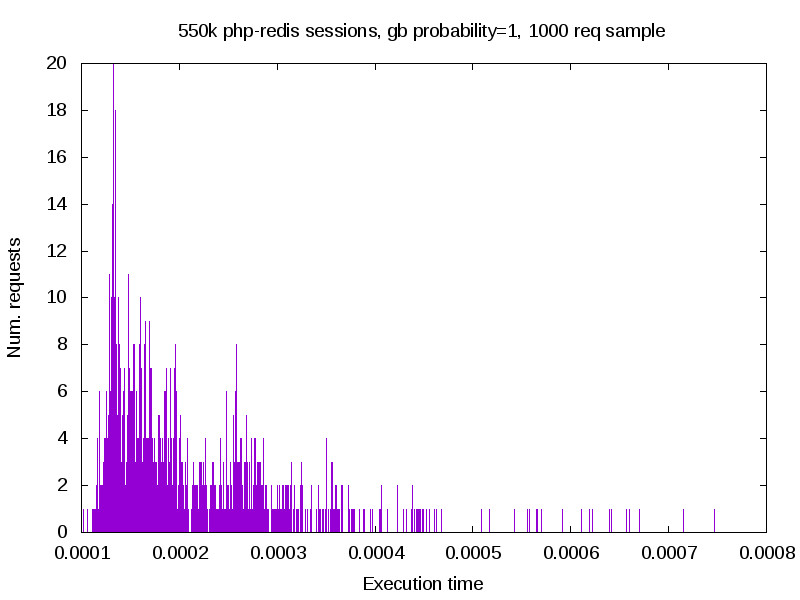
Once completed, I have adjusted gb_probabilty gain, and repeated the test:
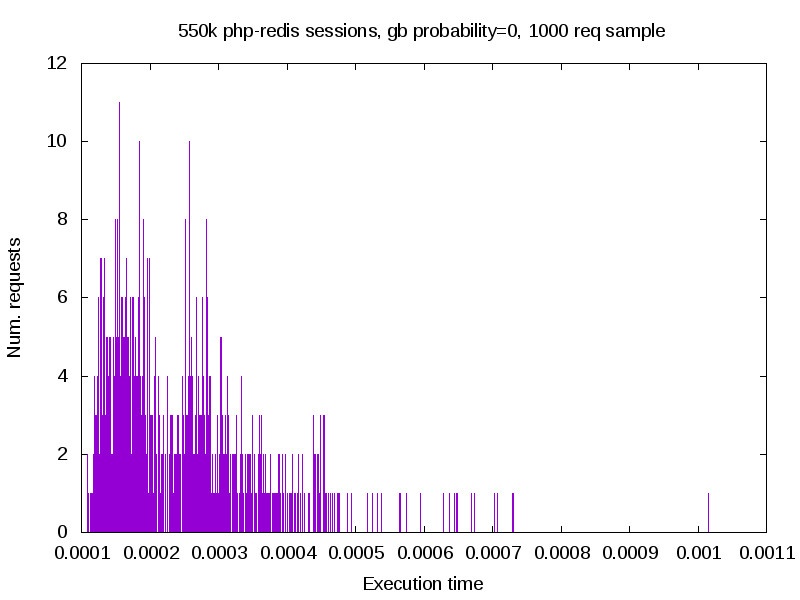
Explaining the results
Unlike the previous test with file-based sessions, there is not really a difference in performance here. And this is basically because Redis internally can deal with session lifetime, which means that PHP does not have to. In other words, GC settings related to session no longer have influence on application performance.
Conclusion
Looking back at two examples, you can clearly see the difference between two storage types. Even though file storage is somewhat faster for majority of requests, it becomes an issue with large number of files. Even though only smaller portion of session files is actually deleted, when GC is triggered, all files will be checked. You can overcome this by disabling GC, but keep in mind that in such case, you must setup your own GC to serve the same purpose (cron process that relays on file system time-stamps). Of course, you can better time it, and it is enough to execute it once per day to lower stress, but it needs to exists.
On the other hand, you can use Redis, which is somewhat slower. How much slower, it depends on your setup. In my case, Redis was running on the same machine and we can observe performance penalty of 1ms in average. If the setup is different and Redis is running on remote server, you can expect heavy impact on the performance (for an example, in case of poor connection between servers).
My recommendation would be to use files with custom GC when application is running on single web server. If you have Multi-node setup, than Redis will be better option for you, but keep an extra eye on speed of the linke between your servers.


