What is customer value reporting in Google Ads? This is a new report found in Google Ads that can help us understand our customers better. And with a better understanding of who our customers are – we can make even better campaigns with ads designed just for them.
Read on to learn how to read and analyze this report and how to use it to improve your campaign results.
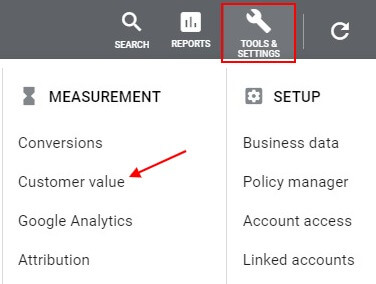
The report is very easy to find. All you have to do is go to your Google Ads user interface, click on Tools & Settings, and under “Measurement” section you will find your new option.
If you are using it for the very first time, you will find a greeting message that explains what this report is all about. It also says that by using this information we should try adjusting our campaigns to reach the best segments of our customers.
This report shows the distribution of your customer base, or shall we say, users, over the previous year or 12 months time frame. This data is broken into three “mini-reports”. Among them, you can find additional data broken down by demographics (gender, age, parental status), locations, devices, and affinity.
Well, any information that can help us reach even higher ROI (return on investment) is welcome any time of the day!
But, first things first.
Requirements for Customer Value Report
There is a possibility that you will not see this report in your Google Ads system. If you don’t see this option then maybe your website doesn’t have a global site tag set up. Also, you have to track the monetary value of every purchase/conversion.
Your campaigns need to be older (active and collecting data) than 12 months. This is because Google ties historical data to every one of your customers to a corresponding audience.
But, even if you have a global site tag set up with tracking the monetary value of purchases – you could still not see customer value reports. Unfortunately, this is because the Google Ads system needs a larger volume of monthly purchases.
How much is “larger” exactly? We don’t know yet.
3 Segments of Customers
The first report you will see is about customer segmentation regarding their “value” for the last 12 months. Value is based on the total value of their purchases. Based on that, Google’s system divides your audience into three groups.
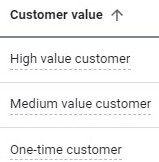
The first group is High value customers that represents the top 25% of returning customers.
Medium value customers are the bottom 75% of your returning customers.
And we have one-time customers that have made only one purchase in the last 12 months.
We must point out that this segmentation is based on the total value of customer purchases, and on whether they are one-time buyers or returning customers.
What Insights Can We Get
Looking at the first example we can see that one-time customers have a very high average total conversion value. Of course, that is when we compare it to the Medium value customers.
Not only that, but we can also see the majority of purchases came from the One-time buyers. Around 80% of all conversions.
Also, if you look at customer lifespan in weeks we can see that Medium value customers have only one week. This means that there are only around 7 days between 1st and last purchase for that segment of customers. Only 7 days.
In comparison, for High value customers, there are 9 weeks between the first and last purchase.
How can we improve our results based on this information? We can surely try to convert One-time buyers to repeat customers. At least, looking at the difference between average total conversion value (Medium vs One-time) we could conclude that our revenue would grow substantially if we turn one-time buyers in returning buyers.
And how do we do that?
For example, this can be done with Gmail ads & proper use of audiences. Yes, we are talking about remarketing audiences with proper segmentation (days from the first visit).
We can make specific ads (Gmail, display, video) for audiences for which there have been up to 8 days from the first visit. This is for targeting Medium value customers.
For targeting High value customers we can make specific ads targeting audiences between 8 and 65 days from the time of the first visit.
Now, let’s take a look at the example number 2.
The situation is almost the same, but there are certain differences. For example, the average customer lifespan is much longer. The average total conversion value for One-time customers is much smaller in comparison to Medium value customers.
But what is even more important here is that the average total conversion value for High value customers is almost 200 times higher than for One-time customers.
Of course, this also depends on the actual type of products/services sold in this example. Anyway, looking at this report, we must make further investigation on why there is so big a difference in total conversion value (High vs One or Medium).
There is one important note here. Although the average total conversion value is only $1 for One-time customers, when we look at the total number of customers (or their conversions), we see that the total amount is above half a million dollars ($567.800). And that’s not a small number.
But, High value customers have contributed with over $7.800.000 in total purchases.
The main effort in this example, again, is that we should try to turn One-time customers to returning customers.
Looking at example number 3 above, we can again see a very similar situation. Again, we should try to target High value customers with proper use of remarketing audiences (between 30 and 140 days).
Also, do not forget the target audience for longer than 140 days. Why? Because 20 weeks (or 140 days) is only an average lifespan.
Demographics of Customer Segments
The next report can help us get some valuable insights into the demographics data of our customers. For these examples, we shall look only at High value customers.

What we see here is that men are more inclined to buy our products at a high value. Looking at the age of our customers we see that the 25-34 age group is the best group among High value customers.
Also, when looking at parental status we see that parents are more ready to buy the high value products. So, the best demographic group in this example is – men between 25-34 years old who are parents.
How can you use this information? We could have a separate campaign in which we target the right demographics with the right ads made just for this group, or make specific ad groups targeting that group, or…

In this example, we see a similar situation. The only difference here is, that people who have no kids are more ready to be our customers.

In the third example, men are several times more ready to buy our products or services. And the best age group is over 55 years old.
Not all Locations and Devices Are the Same
The location part of the report is useful if you want to see where your best buyers are located.
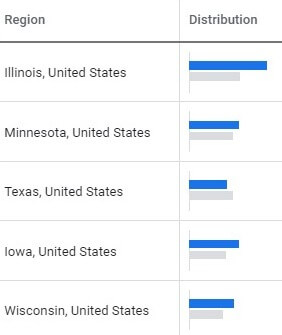
Then, you can make bid adjustments for those locations. Or, create separate campaigns targeting those locations (with specific ads directed to those segments of your customers).
The part of Customer Value Report which I like the most is the part where we see how our customers are behaving in comparison to different devices.

What we see in the picture above is that Medium value customers are using the devices pretty much the same as the overall average customer. But, when we look at how High value customers are using the devices:

The difference is more than obvious. High value customers are using/coming from computers 98% of the time. And only 1.6% are using their mobile phones.
We can use this information in having bigger budgets for campaigns that are targeting computer devices (and higher value customers). Or, we can have additional bid adjustments for computer devices.
Want More High Value Customers?
Let’s face it. We all want the best possible customers who will spend the most on our eCommerce website. And one of the greatest problems is to find those types of customers.
But, if you look at the affinity audiences part of the Customer Value Report, you will see just that kind of information.
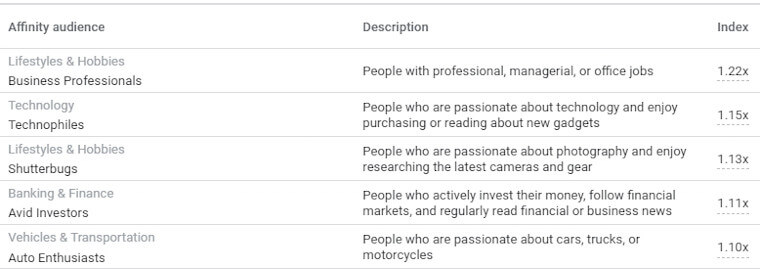
Using this type of information we can make special display campaigns with specific ads directed to our targeted audiences. For example, you can create a display campaign targeting those types of affinity audiences (shown on the picture above) with the right combination of demographics targeting (see above-mentioned examples).
Benefits of Customer Value Report
Now it’s very easy to see what are the benefits of this new report. We can now see how important it is to ask ourselves just what types of customers do we have. Who they are regarding brand loyalty for our products.
We can now see that maybe our sales are driven by a small group of customers, or maybe that our main revenue is driven by a large group of medium value or one-time customers.
We can use all this information to make the right plans and strategies for achieving even greater ROI.
How?
For instance, use the information on demographics, devices, locations, and proper remarketing audiences to create marketing campaigns that target your best customers. Of course, do not forget to create special ads aimed at just those segments of your customers you want to reach.
This is the report that can make a huge difference for your bottom line. But only if you make the right steps with your Google Ads campaign optimization.
Have any questions? Leave them in the comments section!


