Superweek [#spwk] is an annual conference held in northern Hungary (but still close enough to Budapest airport) covering all apsects of (web) analytics – from decision making to real life events tracking.
Located in the Mátra hills (Galyatet?), in a touristy ski area just on a height of ~50m below highest Hungarian peak (Kékes – 1014m), it promised and was advertised as “hill, snow, Avinash” conference for analytics addicts. Although first few days were short on snow, everything that was promised – was delivered! With a coating of heavy winter fog. Conference in a glass of milk. With Avinash.
Content part of the conference can be condensed in a few words: business value, real life, server and social tracking, d3js, Avinash, GTM tips’n’tricks.
Let’s start with Avinash, Avinash Kaushik – conference and analytics super-star. Can’t recall a presentation or talk without his name being mentioned at some point.
Mission accomplished. Now we can go home. #spwk @superweek2014 http://t.co/foKhRfJHgl
— Escape d.o.o. (@escape2web) January 22, 2014
Posing with Avinash and the guys from Escape studio
Business value
After almost all possible tracking concepts of digital analytics were proved and used (mainly using GA/UA/GTM) – the time has come to put the all that vast oceans of collected data into proper perspective – business value and business decisions.
Collected data is just the blurred beginning, a part of the picture and what’s most important – it doesn’t bring any business value by itself. It has to be interpreted by analysts or integrated in the whole decision-making process in the company. That’s where and when data brings real value.
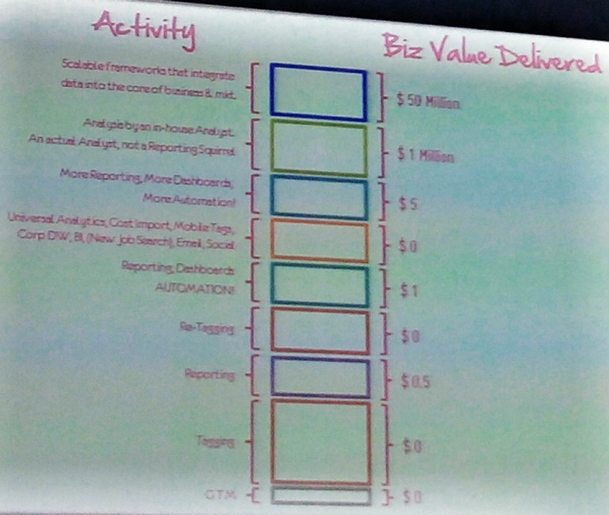
Proper data presentation, interpretation, and integration are the challenges of the time that’s coming. As Peter O’neil said – it’s the “see this – do that” analytics concept.
D3.js is a JavaScript library for manipulating documents based on data. D3 helps you bring data to life using HTML, SVG and CSS.
D3JS is becoming a data-visualization standard on the web. Period.
Have you already used D3JS in your Magento projects and used it to create nice looking Magento reports?! Can you share your examples and usage? 😉
More on tracking (real-life, server-side transactions/tracking):
As analytics is going towards business decisions, so is tracking moving from revenue to profits. Having revenue, margins and profits tracked in Google Analytics is a piece of cake with measurement protocol. Easy and safe (keeps away those information from your competition) , as ecommerce transactions are tracked using server-side requests.
Another migration is happening in the context area. Digital analytics is no longer used for tracking user behaviour strictly in digital context, but has moved to real world as well – tracking customers in brick’n’mortar stores. And all that using commodity hardware – as presented by Sam Briesemeister – simple and relatively cheap devices such as Raspberry Pi. See an example from Julien Coquet, also one of the speakers on the Superweek 2014.
Read more:
Superweek 2014. slides/materials can be downloaded here: Superweek 2014. slides
