
When looking at year over year eCommerce conversion rate growth (or fall) many eCommerce business owners might come to wrong conclusions unless they dig deep enough.
There are many things that influence your conversion rate on every online store, but we usually concentrate only on those that we can actually influence. Those that have to do with website’s layout, design, trust signs and usability in general.
If one does not dig deep enough into the Analytics data, one might come to a completely wrong conclusion that the UI changes that were done in the given time period negatively or positively influenced the conversion rate when UI changes might not be the thing to blame or take the credit.
When traffic source shifts can lead to wrong conclusions
What many people often overlook is that conversion rate also depends on the source of traffic. While your organic search traffic might convert at X%, your social traffic probably converts at a much lower Y%.
If the periods you’re comparing have large variations in traffic sources (a product or article of yours for example might have gone viral in a certain period on certain social networks), that would give you a very wrong picture of your conversion rate performance year over year.
For this reason you always want to compare conversion rates by source to figure out if you’re growing or not. So compare apples with apples. Organic traffic conversion rate year over year vs organic traffic conversion rate. Paid search traffic with paid search traffic. Referral with referral. Social with social.
Never assume that your UI changes made your conversion rate worse unless you compare each traffic source individually.
The more you can segment, the more accurate your comparison can be, so you might even want to go so far to compare Twitter’s social traffic with Twitter’s social traffic conversion rate, and Facebook’s social traffic with Facebook’s social traffic’s conversion rate.
When total conversion rate is down, but device types segmentation shows conversion rate growth on all devices
Another major thing that can influence your conversion rate is visitor’s device type. We’re talking desktop, mobile, and tablet. In the last few years, many online store owners might have seen something very strange in their Google Analytics.
Imagine a situation like this:
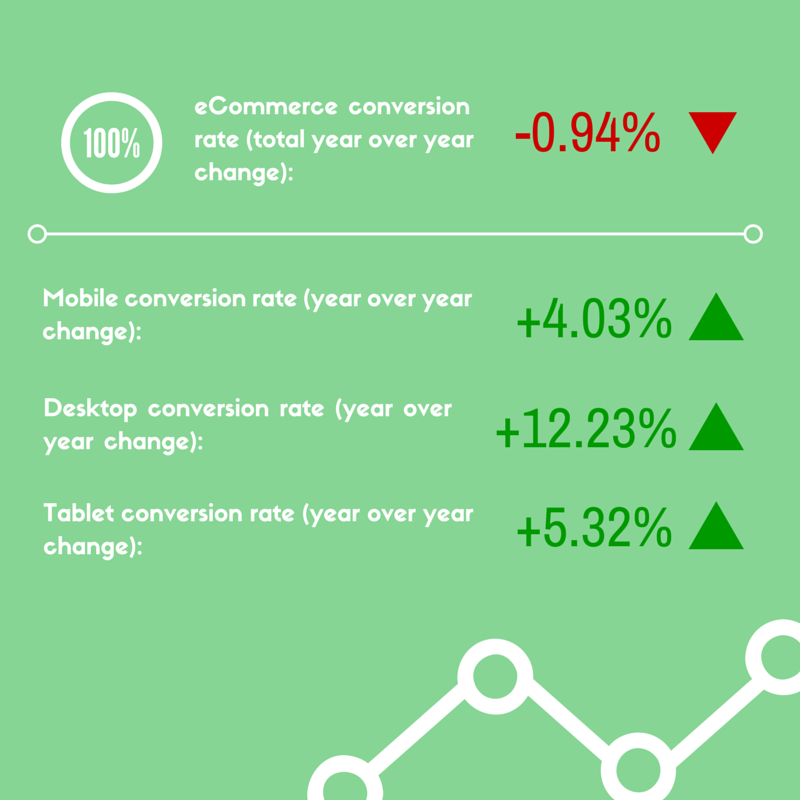
So mobile, tablet, and desktop are seeing significant conversion rate growth, but their total conversion rate has fallen. How is this even possible?
The answer in many cases is: the rise of mobile.
With the extreme growth in mobile visitors that online stores are seeing in the last few years, many came to situations where their mobile traffic is growing at a much faster rate than their desktop traffic.
Since mobile converts at a lower percentage than desktop does, even though the site is earning more money and having more visitors and having better user experience than last year across all devices, the total eCommerce conversion rate of the website is falling.